Manual page for web-server CisCross-Main
General description
Web-server CisCross-Main is an application for searching potential regulators transcription factors (TFs) of the input gene list.
Input data
CisCross-Main takes a list of genes. A user can use any list of genes. It also could be differentially expressed genes. Publicly available gene expression databases, for example the EBI Expression Atlas (Moreno et al., 2022, https://www.ebi.ac.uk/gxa/home) is a good source of qualitative transcriptomic data.
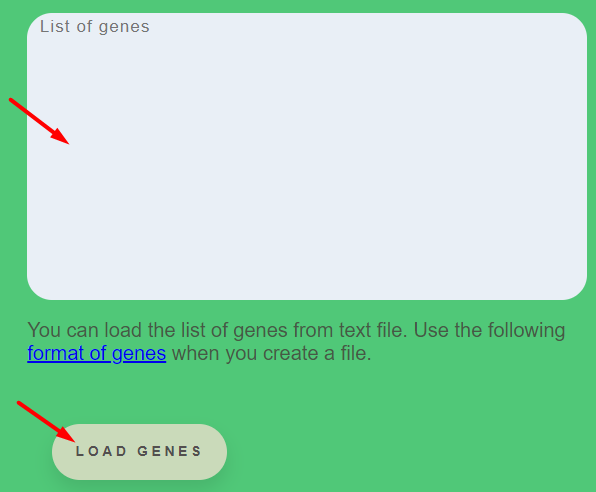
The Button Load genes allow file the field List of genes or insert gene list from the clipboard. Genes should be name with TAIR ID, for example AT1G05680. On the web page, there is the recommendation for creating a fill (format of genes).

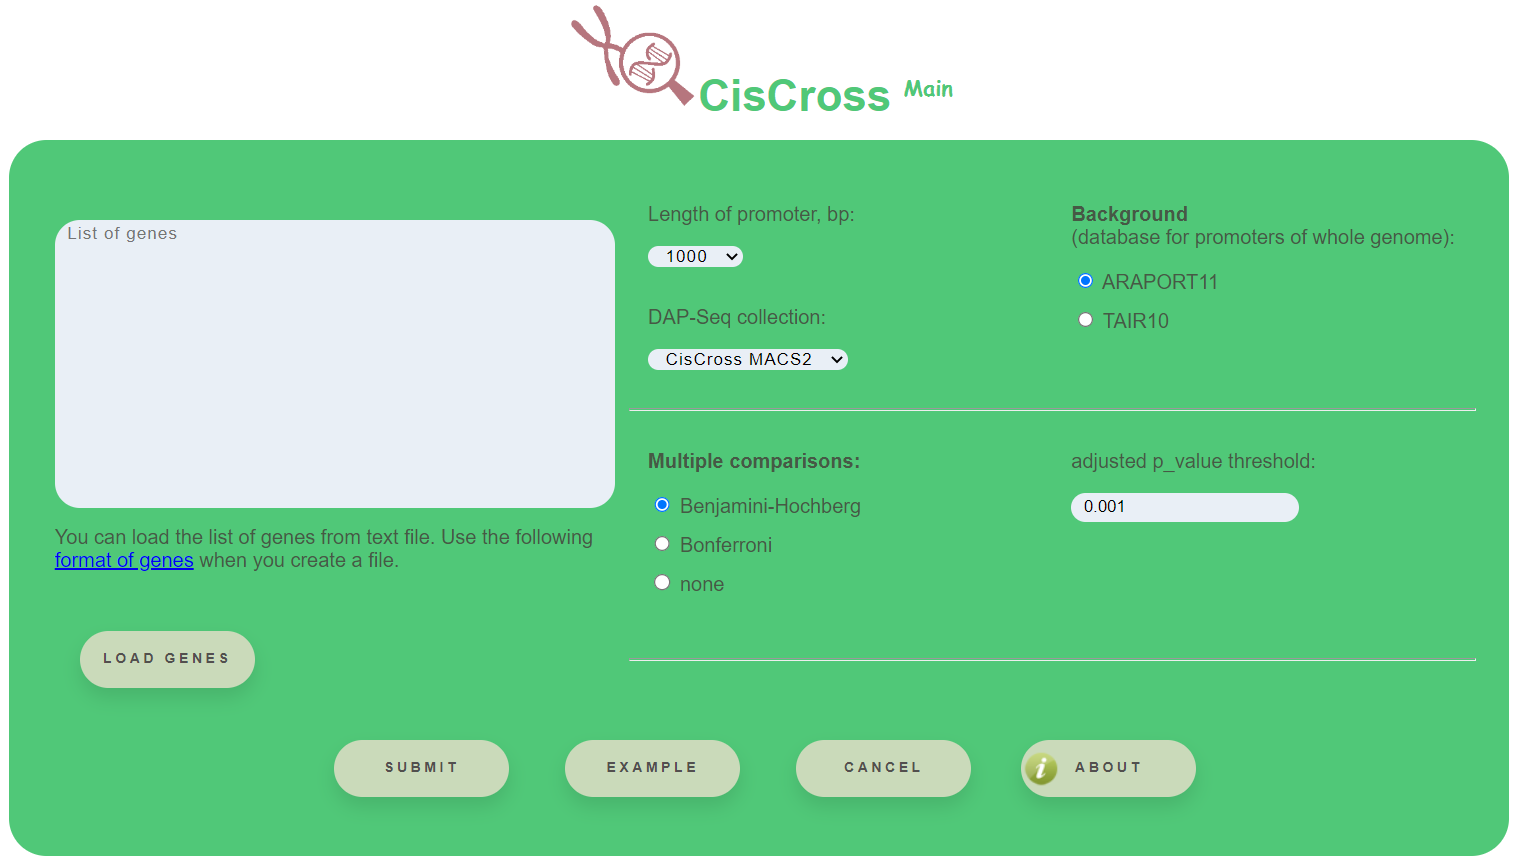
CisCross-Main requires the next selections:
- Length of promoter (bp) – whole-genome annotation of gene promoters as the regions of 500, 1000, 1500, 2000 or 2500 bp upstream to the transcription start sites
- DAP-Seq collection – the available versions for the DAP-Seq peak set collection are (1) Plant Cistrome (O'Malley et al., 2016); (2) CisCross-GEM (GEM-processed); (3) CisCross-MACS2 (MACS2-processed)
- Background – can choose between Araport11 and TAIR10 annotations of the reference genome

Options for the multiple testing procedure are: Benjamini–Hochberg, Bonferroni methods or none. Also it is available to choose the threshold for the output list of TFs

All required sections contain default values.
To run the algorithm of TFs enrichment analysis push the button Submit.

To test the workflow use the button Example.
Output data
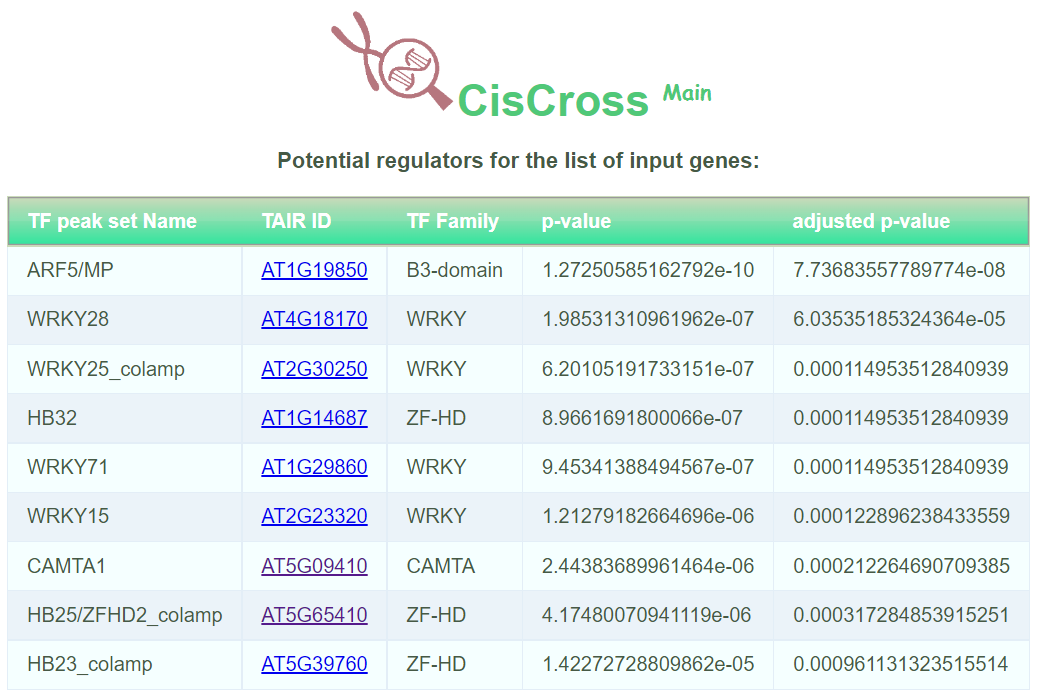
Output data of CisCross-Main represents the list of potential upstream regulators in ascending order of the significance p-value with adjusted p-value (or FDR)

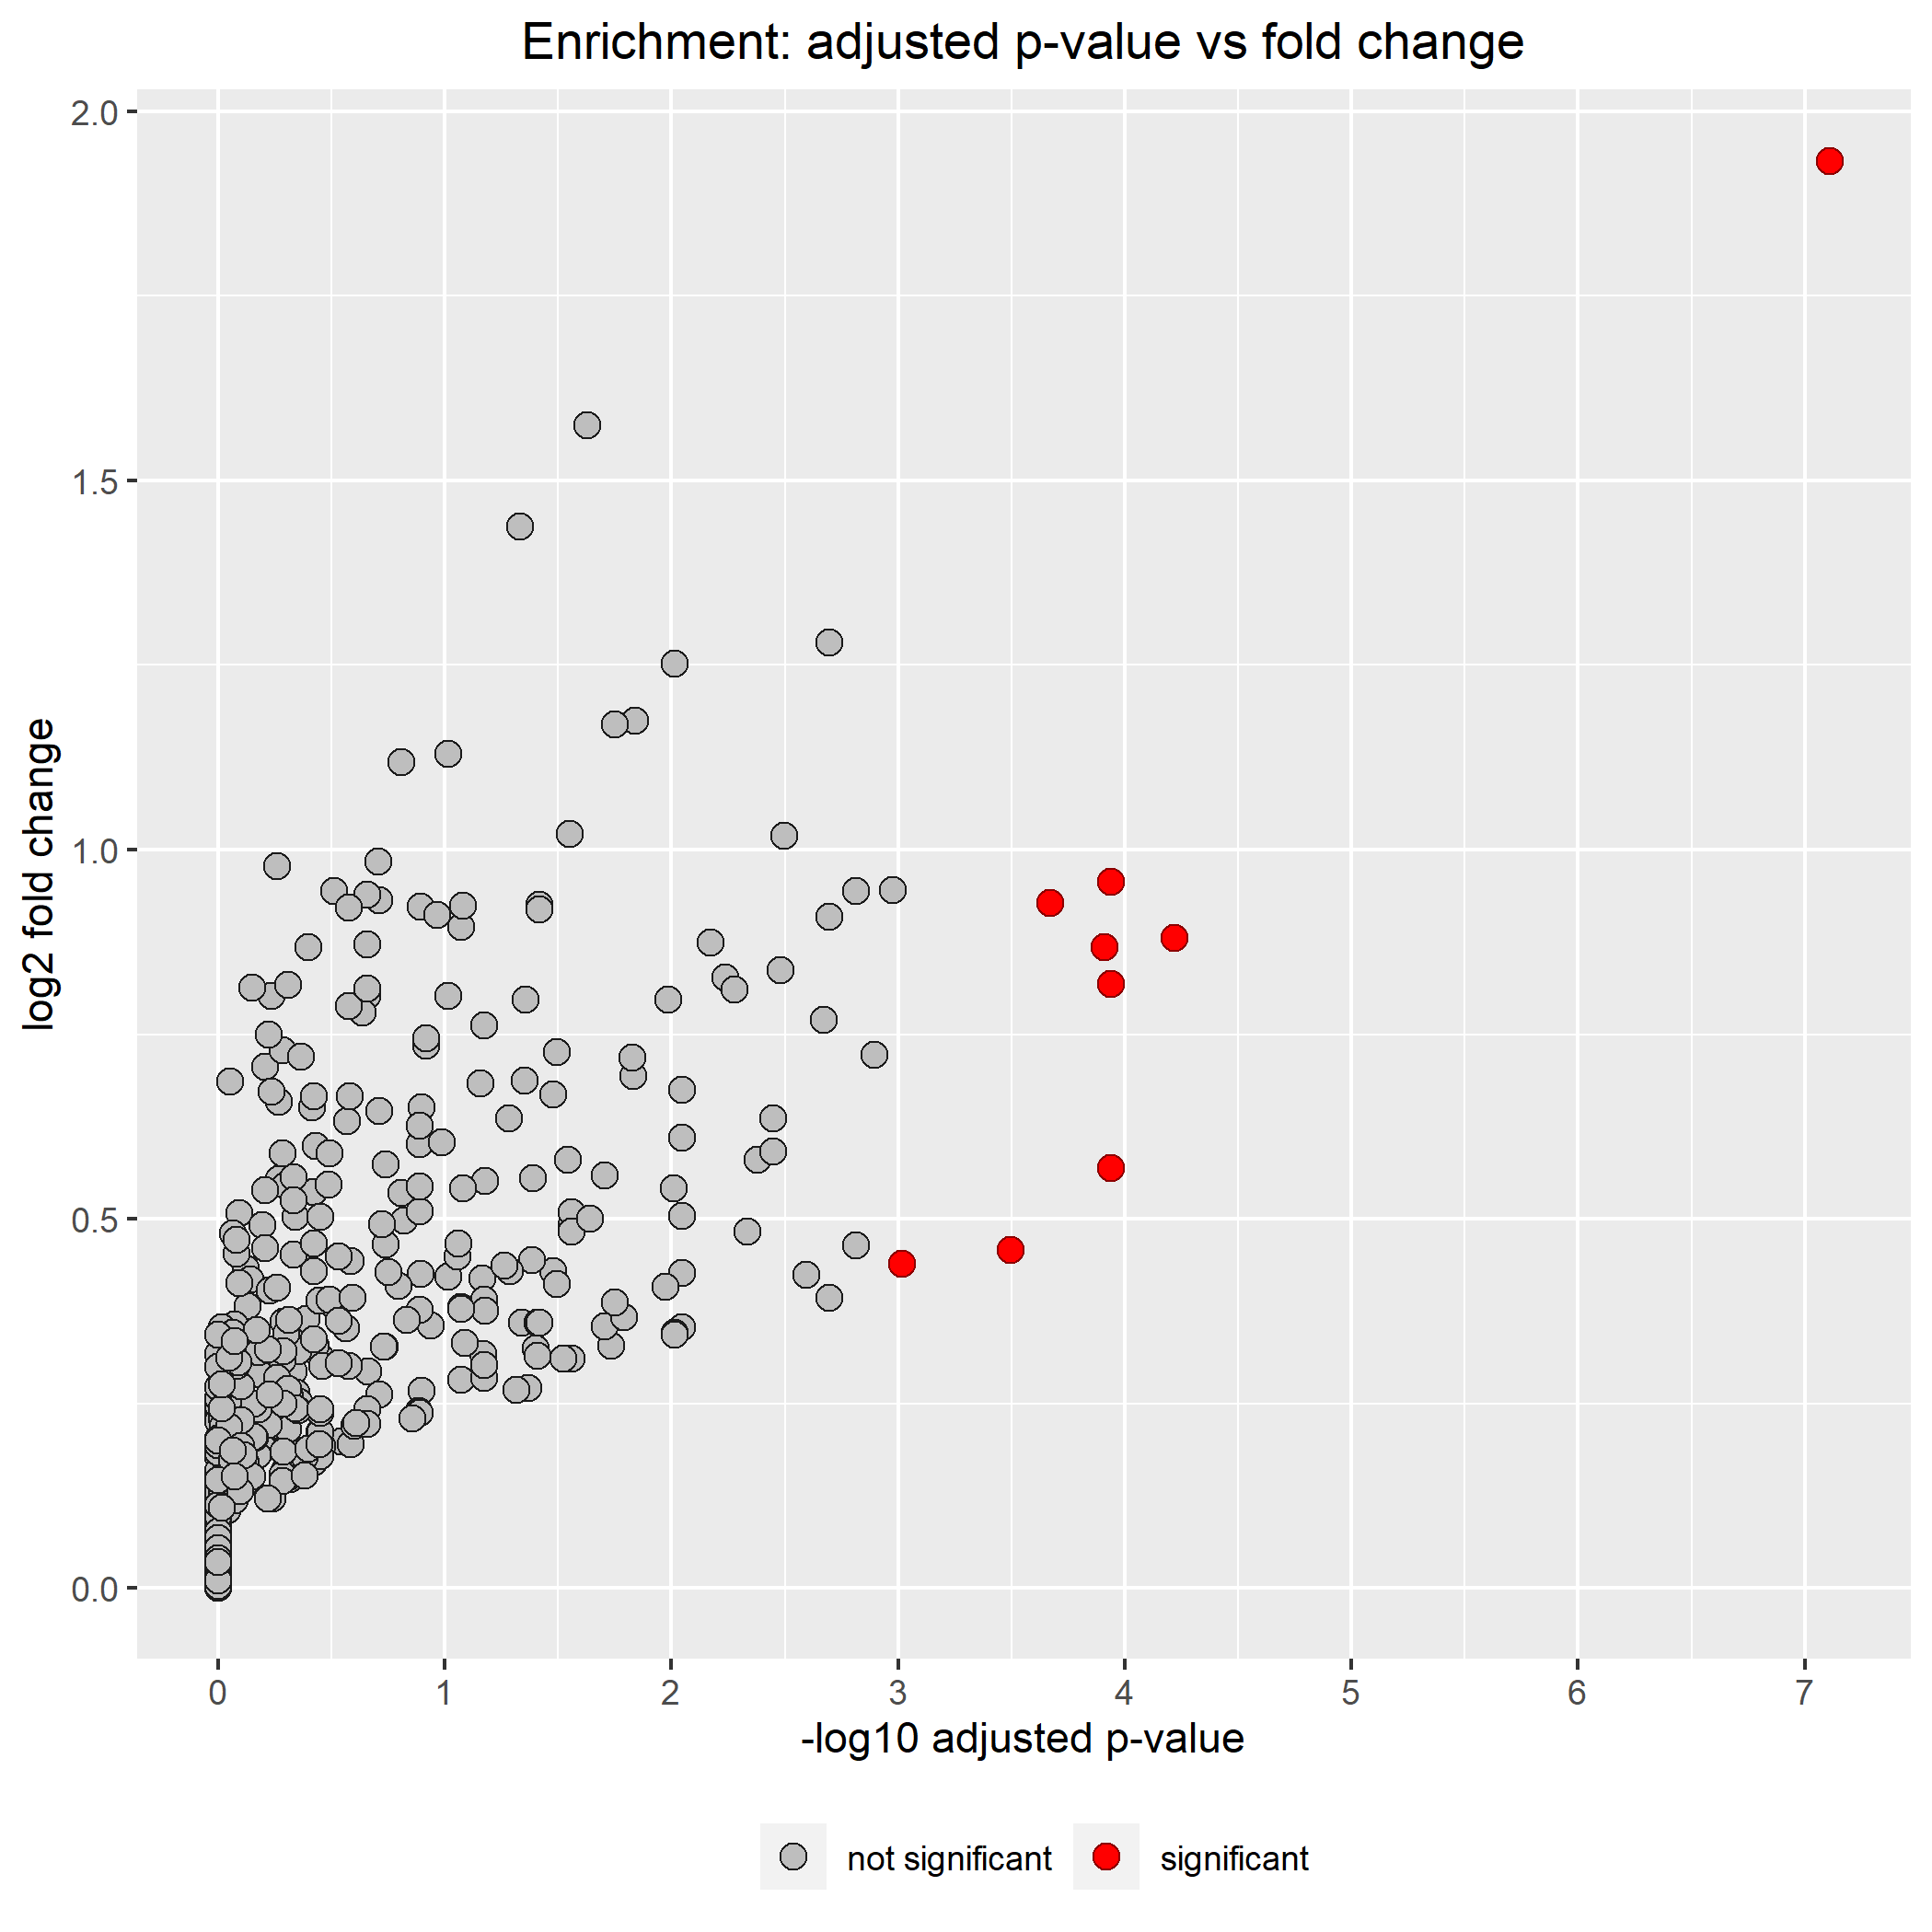
and enriched dot plot, where dots represent TFs with the fold ratio exceeding one. The dots display (a) TFs, which binding sites are significantly enriched in promoters of the input genes (potential upstream regulators, red dots) and (b) TFs with the fold enrichment exceeding one, which did not pass the significance threshold (gray dots). For each, TF the X-axis shows the base 10 logarithm of adjusted p-value, Y-axis shows the base 2 logarithm of the fold enrichment. The fold enrichment is the ratio of the foreground and background factors, where the foreground factor means a portion of the number of promoters of the input genes overlapping peaks among the total number of promoters of the input genes; and the background factor denotes a portion of the number of promoters of the rest genes overlapping peaks among the total number of promoters of the rest genes

The list of input genes printed after "Enriched dot plot"
Extending information about TF families assignment
To save results use the button Save below list of input genes.
The button "Save gene-to-TF" saves the gene-to-TF table, where for each enriched TF specified its targets among the input list of genes.


